In this tutorial, we will use the the summarise_days() function and D3.js to create a graph of your recent day lengths. This tutorial assumes a basic understanding of HTML and JavaScript, and assumes you have already created a sleep diary in a supported format.
Step one: create your folder and HTML
Create a new folder called day-length-graph. This is where all our code will go.
Now open a text editor and create a file called index.html in your day-length-graph folder. Paste this HTML into the file:
<!DOCTYPE html>
<html lang="en">
  <head>
    <meta charset="utf-8">
    <title>Day length graph</title>
  </head>
  <body>

    <div><input type="file" id="diary-input"></div>

    <svg style="background:#eeeeee" width="600" height="500">
      <text style="white-space:pre-wrap" y="20" id="svg-text">
        (graph goes here)
      </text>
    </svg>

    <script src="https://cdnjs.cloudflare.com/ajax/libs/d3/6.3.1/d3.min.js"></script>
    <script src="https://sleepdiary.github.io/core/sleepdiary-core.min.js"></script>
    <script src="index.js"></script>

  </body>
</html>
When you open the file in your browser, you should see a page with a file input and a light grey rectangle with the text “(graph goes here)”. The input doesn't do anything just yet - we'll add that next.
Step two: load your sleep diary
Create a new file called index.js and paste in this JavaScript:
var diary_loader = new DiaryLoader(
    (diary,source) => {

        // convert from your program's format to the Standard format:
        var diary_standard = diary.to("Standard");

        document.getElementById("svg-text").innerHTML = JSON.stringify(diary_standard.records,null,' ');
        console.log( "Here is your data in Standard format:\n", diary_standard );

    },
    (raw,source) => {
        alert( "Could not load diary" );
    }
);

document.getElementById("diary-input")
    .addEventListener( "change", event => diary_loader.load(event) );
Now refresh the page and click on the file input to load your diary. The grey box should show the first few records. You can examine the whole diary by pressing ctrl + shift + C (Apple + shift + C on Mac), and clicking Console.
Step three: analyse your sleep diary
Now we've loaded your data into JavaScript, we need to calculate how long your days have been. Find this bit in your JavaScript:
        document.getElementById("svg-text").innerHTML = JSON.stringify(diary_standard.records,null,' ');
        console.log( diary.to("Standard") );
Replace it with:
        var cutoff = new Date().getTime() - 14*24*60*60*1000; // 14 days
        var summary = diary.to("Standard").summarise_days( r => r.start > cutoff );

        document.getElementById("svg-text").innerHTML = JSON.stringify(summary,null,' ');
        console.log(summary);
Save the file, refresh the page and reload your diary. You should see summary information about your last 14 days. If you see null instead of summary information, edit the cutoff line to include older records.
Have a look around your data. There's a lot there, but durations is the only part we'll use in this tutorial.
Step four: prepare your data for D3
To make a bar graph, D3.js needs to know the label and height of each bar. More specifically, it needs three variables: a list of labels, a list of heights, and a list with both together.
Replace the svg-text and console.log lines with these:
        var bars = summary.durations
          .map( (height,n) => [height,'day ' + n] )
          .filter( r => r[0] ) // remove missing values
        ;

        var heights = bars.map( d => d[0] );
        var labels = bars.map( d => d[1] );

        console.log( bars, labels, heights );
Once again, save the file and examine the console before you carry on.
Step five: create the graph
Now we need to tell D3 to display the graph in your <svg> element. Replace the console.log line with the following:
        // remove the "graph goes here" message:
        d3.selectAll("svg > *").remove()

        // initialise the <svg> element:
        var svg = d3.select("svg"),
            width = svg.attr("width") - 50,
            height = svg.attr("height") - 40,
            xScale = d3.scaleBand().range ([0, width]).padding(0.4),
            yScale = d3.scaleLinear().range ([height, 0]),
            g = svg.append("g")
              .attr("transform", "translate(49,15)")
        ;

        // define the size of the X and Y axes:
        xScale.domain(labels);
        yScale.domain([d3.min(heights) * 0.95, d3.max(heights) * 1.05]);

        // populate the graph:
        g.selectAll(".bar")
            .data(bars)
            .enter().append("rect")
            .attr("x", d => xScale(d[1]) )
            .attr("y", d => yScale(d[0]) )
            .attr("width", xScale.bandwidth())
            .attr("height", d => height - yScale(d[0]) )
            .style("fill", "steelblue")
        ;

        console.log( "Created a graph of size " + width + "x" + height );
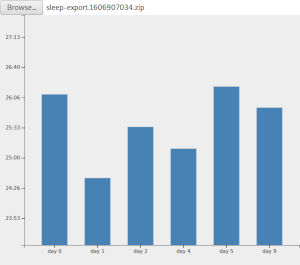
Now when you refresh and load your diary, you should see a list of bars showing how long your recent days have been.
Step six: add some labels
Now you have a bar graph, so the last step is to add some labels to it. Replace the final console.log with this:
        g.append("g")
            .attr("transform", "translate(0," + height + ")")
            .call(d3.axisBottom(xScale))
        ;

        g.append("g")
            .call(d3.axisLeft(yScale).tickFormat(
                t => {
                    var hours   = Math.floor( t / (60*60*1000) ),
                        minutes = Math.floor( t /    (60*1000) ) % 60
                    ;
                    return hours + ( minutes < 10 ? ':0' : ':' ) + minutes;
                }).ticks(10))
            .append("text")
            .attr("y", 6)
            .attr("dy", "0.71em")
            .attr("text-anchor", "end")
            .text("value")
        ;
This tells D3 to add labels to the X and Y axes. Now you have a graph of your recent day lengths!